Business Database Redesign
Gale In Context: For Educators K-12 Course Platform
Project
Education, K-12, Curriculum, Classroom, Courseware, ELA, Social Studies
Domain
Ideation, requirement definition, research, design, testing, scoping
My Role
Project Time
18 months
Gale Business Insights (BI) was a business research database released in 2011 targeting academic libraries and public library consortia. It’s primary users were undergraduate business majors, business librarians and reference librarians. BI’s architecture was based around company, country and industry data, which largely aligned to the topic that drove students to conduct research. It’s content numbered in the millions: newspaper articles, market share reports, academic journals and company finance reports.
In 2021, I led a UX effort which included a UX Designer, UI Developer and myself. The business goal was to redesign the product experience as it was migrated from a bespoke implementation onto Gale’s shared platform. There were numerous architectural challenges to consider as the fielded data repository was migrated but offered an opportunity to holistically re-imagine how we approached this product’s design.
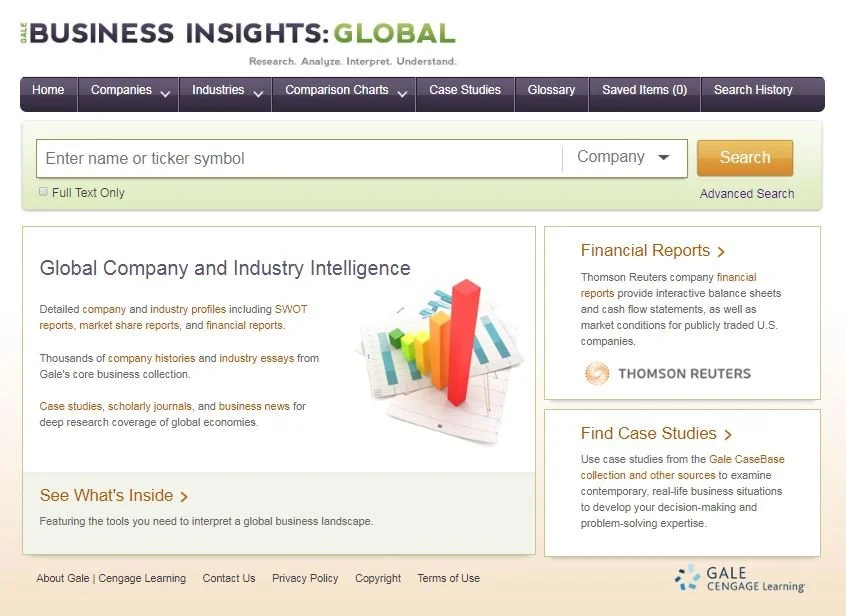
Original home page

Redesigned home page
Problem Space
The 2011 Business Insights release was a slow motion disaster. It was replacing an aging but financially successful predecessor, whose users found BI’s user experience to be a significant step backward. Librarians could no longer find content they had been using for years and students were stymied by a sea of links. Over the next decade, product revenue would decline by 50% due in part to an unfriendly product experience. Our major competitors signed exclusive deals to provide The Wall Street Journal and Harvard Business Review, leaving user experience as a main attribute the product could compete on.
Gale’s business leadership was well aware of this dynamic and attempted multiple ‘band-aid’ solutions over the next decade. BI’s platform and content architecture played a significant role in the usability problems and there were multiple aborted attempts to scope a platform migration. Each attempt ended when the investment required conflicted with that year’s business priorities and the product bled revenue until 2021, when that migration was given a green light.
Problem #1
Users just can’t find the content
An information architecture without clear priorities leaves students wading through a sea of ambiguously labeled links in search of the research they need. We needed to understand what content was most critical to core student tasks and prioritize its display.
Problem #2
Poor UX drives down student usage
Libraries justify their purchases with usage metadata: sessions, searches and retrievals. The poor user experience leads to low student usage, which leads to lower subscription renewal rates. By concentrating on improving the student experience, we can reverse that negative feedback loop.
Problem #3
Accessibility compliance is blocking customer adoption
Customers require a WCAG 2.0 A & AA compliance from their database providers, leaving Business Insights ineligible for consideration due to it’s poor accessibility. Research databases are often designed without accessibility in mind, making WCAG compliance a competitive advantage.
User Research
In the years leading up to the decision to redesign Business Insights, I talked to dozens of business librarians, professors and students about their experience with the product. I was convinced that no ‘band-aid’ solution could address the issues I was hearing about from users. I advocated for a major redesign during the platform migration, which the product team fully supported. I began by conducting interviews aimed at building out our knowledge of the academic business research process.
Starting with undergraduate business students, I mapped out the process of getting an assignment, conducting research and finishing the assignment. I talked with business and reference librarians about their experiences teaching students about library research and gathered their perspectives on what contributes to a successful research experience. Business instructors told me what they assigned, their expectations for student research and what they thought students should take away from those experiences.
Research Insight #1
Undergrads have low information literacy skills
Most undergraduate business students have little experience using research databases or library resources in general. This manifests as a lack of familiarity with common research database design patterns and difficulty parsing metadata-rich search results.
Research Insight #2
Business students are corporate finance novices
Business research features a wide range of finance terms that undergraduates haven’t mastered yet. Providing context and explanations around financial data will be critical for the least sophisticated users.
Research Insight #3
‘Premium’ company reports are hard to come by and valuable
Students were looking for SWOT reports and high-level company financial performance over multiple years. They were unable to reliably find this data on the open web but many assignments need this type of content to be properly completed.
Persona Development
Using those interviews, I developed a set of 20+ ‘thumbnail’ personas including graduate and undergraduate students, business professors and librarians. Each persona represented 2 specific pieces of user context and goals. I guided the product manager through a prioritization exercise, leading to the creation of a persona map centered around upper-level undergraduates. Our primary persona, Kathryn, is a senior undergrad business major conducting in-depth research on a specific company for a multi-week assignment. She needs both detailed financial data about the company and information about the broad industry, leadership and political context in which the company sits.

Design Sprint
With personas in hand, I scheduled a 4-day design sprint with stakeholders from product, content development, content engineering and engineering. Using Jake Knapp’s Sprint: How to Solve Big Problems and Test New Ideas in Just Five Days as a general methodology, we spent the next 3.5 days moving through map, sketch, decide and prototype. At the end of day 4, we tested our prototype with several undergraduate business students. The results were promising, though in need of iteration in places.


Usability Testing & Design Iteration
I conducted 2 rounds of usability testing over the next 6 weeks, feeding insights to my lead designer. In particular, we rigorously prioritized the data we displayed on the company, country and industry pages. Business research is a data heavy domain and a key problem is that undergraduates struggle with the information density of a typical research database. They also want a ‘one stop shop’ of everything they need in one place. To address this problem, our design featured aggressively chunked sections with clear labeling and generous spacing. These sections display the most critical info coupled with a call to action leading to a more comprehensive view.
Feasibility and Scoping
As I finished the final round of usability tests, my lead designer left for another opportunity. I finished the final design iteration and documentation myself in preparation for the development phase. As the development start date approached, I scheduled ~12 hours of requirement and feasibility analysis with a multi-functional team. We walked through each page of the design with a goal of identifying the location, format and consistency of all underlying content and metadata needed to make the design work.
Project Outcome
Due to my diligence in preparing requirements, nearly the entire project scope was built without the mid-stream interface changes that occur when not enough planning has been done. After being released on schedule, Gale Business: Insights saw significantly increased user satisfaction coupled with a small but meaningful increase in usage. The enhanced accessibility compliance left it eligible for inclusion in RFPs and it remains a core part of Gale’s product bundling strategy.
Design Highlights

Original company profile page

Redesigned company profile page
Company Profile Design #1
Focus on the company, not the market context
This design prioritizes company specific content over competitor and industry data. SWOT reports and financial performance get their own section as the two most frequently used data sources.
Company Profile Design #2
Visualize financial data over time
A company’s historical revenue can be difficult to parse as a text list. Displaying this data as a graph allows net and gross profit to be displayed and provides a route into the visualization tool.
Company Profile Design #3
Introduce users to a sampler of content
With the addition of a ‘Company Articles’ section, users are exposed to the wide variety of content types available on a profile page. Article titles provide valuable navigation clues and users can search within all content about this company.

Original company financials

Redesigned company financials
Financial Performance Design #1
Distinct sections makes for easier reading
This design uses a combination of sections, dividing lines and white space to break up the dense tables, enabling higher readability. Blank rows are omitted and can be shown by toggling ‘show all metrics’.
Financial Performance Design #2
Redesigned controls for clearer view manipulation
Instead of radio buttons adjacent to tabs, a left aligned tool panel supports the top tasks of viewing multiple reporting periods, comparing companies and downloading the data.

Original compare companies tool
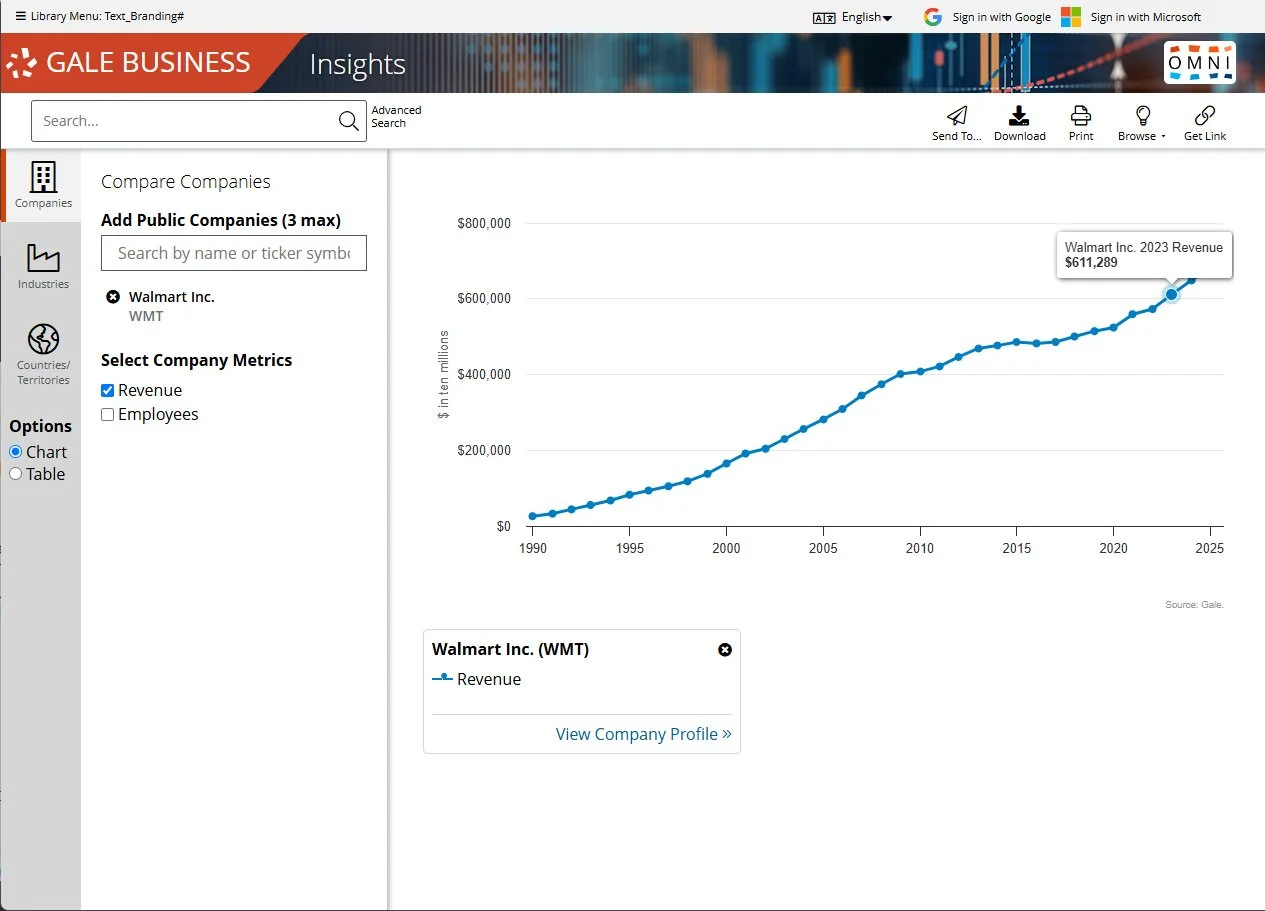
Redesigned compare companies tool
Visualization Tool Design #1
One visualization tool to rule them all
This design condenses 3 separate pages into one by using a tab panel to toggle among entity comparison types. During testing, users found it easier to move among and use the tools.
Visualization Tool Design #2
More coherently grouped controls
The controls for adding an entity or metric to the graph, or swapping visualization type are more visible and offer easier customization. Grouping these together reduces the instances of testing participants missing one or more controls.
Visualization Tool Design #3
The graph has become legend-ary
Students were looking for SWOT reports and high-level company financial performance over multiple years. They were unable to reliably find this data on the open web.